
Guides / Interactive diagrams with popups
How to Make an Interactive Diagram with Popups
A complete walkthrough: turn any shape into a clickable trigger, attach popup detail, and publish the result as a single link anyone can open with no account and no install.
This guide is for anyone who wants to move past static, flat diagrams. Whether you're documenting a process, mapping a system architecture, or building an interactive flowchart, the pattern is the same: keep a clean overview on the canvas, and tuck the details into popups that viewers open on demand. By the end of the guide you'll know how to build one, tune how it behaves, and share it.
No account required
First, here's the finished product ⤵
Drag to pan, then click any node showing a '...' icon to open its popup.
What is a popup, and why use one?
A popup is a hidden panel attached to a shape. On the surface your diagram stays simple; when a viewer clicks (or hovers over) a shape, its popup opens to reveal whatever you put inside, like text, images, links, code snippets, or an entire sub-diagram.
This solves one of the oldest problems in diagramming: many diagrams need more detail than comfortably fits on the page. Cramming everything onto the canvas usually makes the diagram unreadable, and maintaining a separate explainer document requires keeping the two documents in sync. Popups occupy the niche in the middle: the overview stays simple, with depth available one click away, all in a single artifact.
The same mechanism powers several common patterns:
- Clickable diagrams: each shape opens its own detail panel.
- Drill-down diagrams: a shape opens a full, nested sub-diagram, so viewers navigate from overview to specifics.
- Interactive flowcharts: each step of a process carries its procedure, checklist, or policy behind it.
- Collapse / expand nodes: click-to-open popups let viewers focus on one section at a time.
Popups aren't tied to a specific diagram type. Anything you can draw in Vexlio lik block diagrams, flowcharts, network topologies, timelines, org charts, decision trees, all can use popups.
How to build one, step by step
Draw the overview first
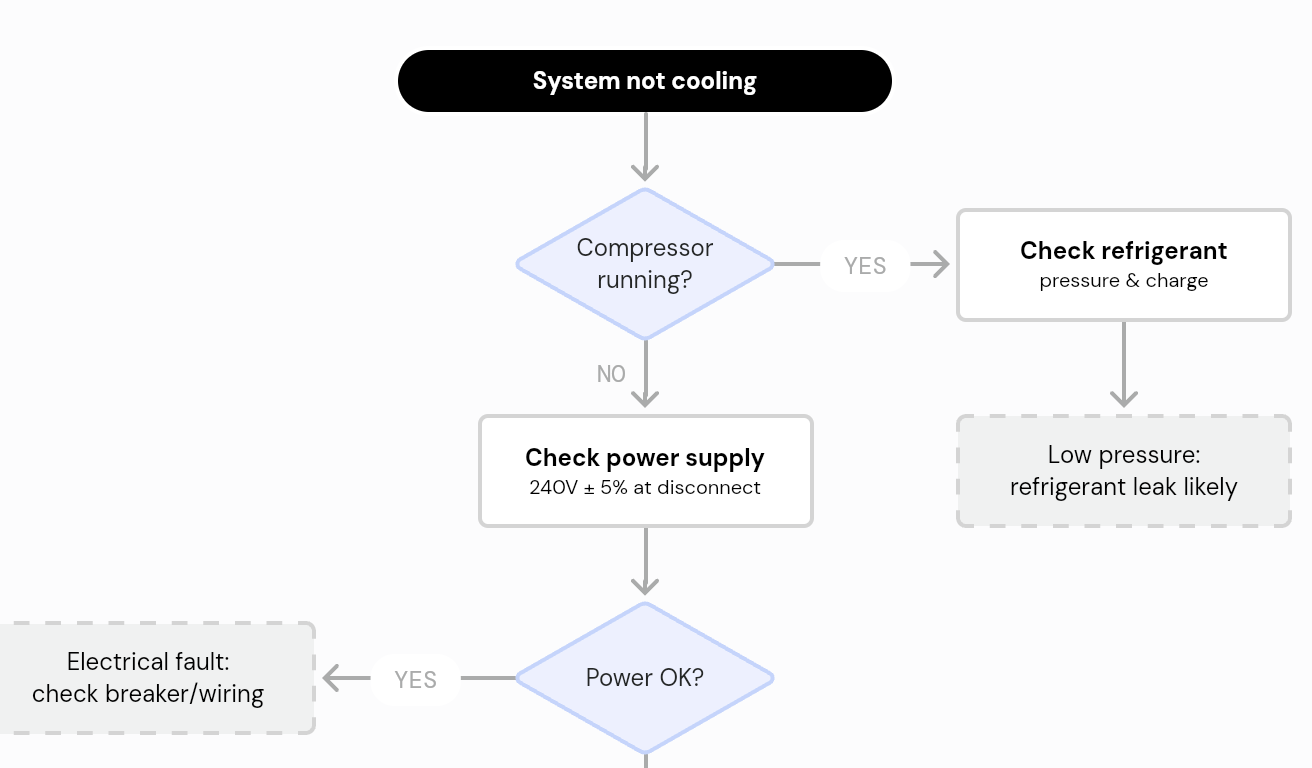
Lay out the high-level picture: a box for each major step, component, or milestone, connected with arrows. The whole point of popups is that detail doesn't have to stay on the main canvas, so keep it simple.
Add a popup to any shape
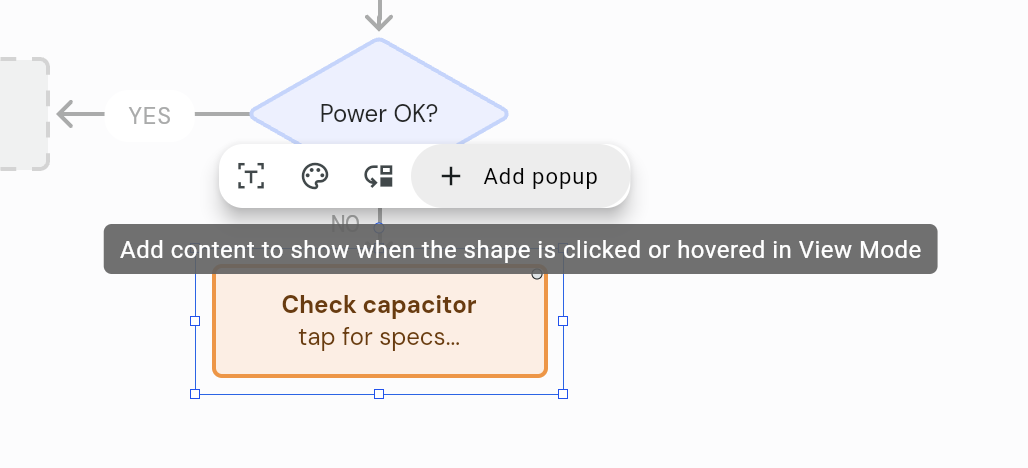
Select a shape and click Add Popup. This opens the popup editor layer, a full Vexlio canvas dedicated to that one shape. There are no restrictions on what goes in: formatted text, images and screenshots, LaTeX equations, syntax-highlighted code, links, or an entire sub-diagram. Add as much or as little as that shape deserves.
Choose how each popup opens (optional)
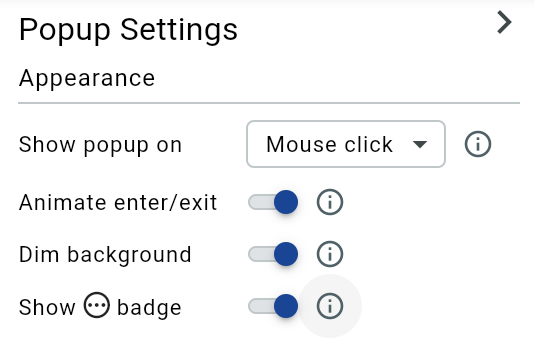
Set each popup to open on click or on hover, per shape. Click-to-open suits active exploration and doubles as collapse/expand for focusing on one area; hover-to-open suits lightweight tooltips. On phones and tablets, both behaviors resolve to a tap.
Publish one private, shareable link
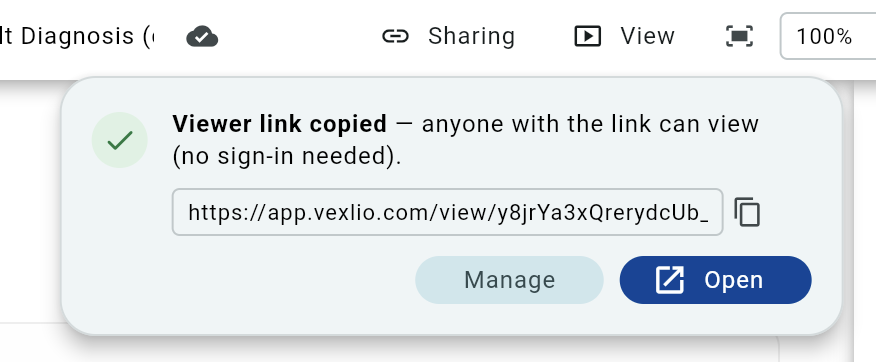
When it's ready to share, publish. Once published, Vexlio hosts the diagram at a secure link and opens it in View Mode: anyone with the URL can pan, zoom, and open every popup. Your viewers don't need a Vexlio account to view and interact with the diagram. Shapes with a popup show a '...' indicator so viewers know where to click. Edit and re-publish anytime; the link stays the same, so you can keep one source of truth instead of re-exporting files.

Embed it anywhere (optional)
Want it inside your docs? Drop the published URL into an <iframe> and Notion,
Confluence, SharePoint, wikis, and LMS tools will render it inline. Append ?embed=1
for an embed-specific view (this is how the live demo near the top of this page is embedded).
Example: an interactive flowchart
Say you're documenting a customer-support refund flow. The overview is a simple decision tree: subscription type, account age, reason code. Each of those steps is just a labeled box on the canvas, enough to grasp at a glance.
Now add a popup to each branch. Inside the "reason code" box, drop the exact policy text a rep can read aloud, a screenshot of the back-office tool, and an escalation path for the hard calls. The main flowchart still reads as a one-screen decision tree, but every step carries the full procedure behind it. Publish it once, and the whole support team explores the same interactive flowchart from a single link.
See a live one: open a demo interactive flowchart →
Tips for popups that actually help viewers
- Keep the overview understandable. If someone reads only the canvas and never opens a popup, they should still be able to understand the big picture. Popups add depth; they shouldn't hide anything essential.
- Match behavior to intent. Use show-on-hover for glanceable context and show-on-click for detail that needs a dedicated space. Mixing the two on one diagram is fine.
- Link out to deep dives. Sometimes you'll need to link viewers to a separate resource like a full terms document, website, etc. Put hyperlinks on text in your diagram; those links become clickable in View Mode.
- Write popups for the viewer, not for you. The person building a published diagram usually has more subject-matter context than those viewing it, so spell out acronyms and define terms they'll need.
- Publish early, then iterate. Because re-publishing updates the same link, you can share a rough version and refine the popups without resending a URL or attachment every time.
Frequently asked questions
Keep going
- How publishing works in Vexlio — viewer links, permissions, and updating a diagram after you've shared it.
- Interactive diagrams with popups — the feature in depth, with more use cases.
- Interactive flowchart maker — flowchart-specific guidance and examples.
- Interactive process documentation — for SOPs and runbooks.